A 10-million-ton shortfall threatens to derail the AI revolution, energy transition, and global rearmament simultaneously
Executive Summary
- Copper prices hit an all-time high of $14,527/ton in January 2026 — up 80% in 18 months — driven by a structural collision between surging AI data center demand, energy transition requirements, and a global defense buildup that far outpaces mine supply growth.
- S&P Global warns of a "systemic risk": a projected 10-million-metric-ton shortfall by 2040 with no realistic pathway to close the gap, as new mines take an average of 17 years from discovery to production.
- The copper crisis is the hidden bottleneck behind three of the decade's defining megatrends — and the geopolitical scramble for control of this "connective artery" of modern civilization is already reshaping alliances, trade policy, and investment flows.
Chapter 1: The Anatomy of a Super-Rally
Copper has always been "Dr. Copper" — the metal with a PhD in economics, whose price movements predict industrial activity better than most forecasters. But what's happening in 2026 isn't a cyclical uptick. It's the beginning of a structural repricing.
On January 6, 2026, LME cash copper breached $13,300 per metric ton for the first time, marking a 50% year-on-year increase. By late January, prices touched $14,527 — an 80% surge from April 2025 levels of roughly $8,000. Even after a 14.5% pullback triggered by the broader Kevin Warsh-induced precious metals crash, copper has held above $12,400, demonstrating resilience that gold and silver have not.
The numbers behind the rally:
| Metric | Value | Context |
|---|---|---|
| LME copper price (Jan 2026 high) | $14,527/ton | All-time record |
| Year-on-year increase | +50% | Fastest since 2021 |
| 2026 projected deficit (ICSG) | 150,000 tons | Conservative estimate |
| 2026 projected deficit (J.P. Morgan) | 330,000 tons | More aggressive |
| Global visible inventories | ~14 days of demand | Near-critical levels |
What distinguishes this rally from previous copper booms — the China-driven supercycle of 2003-2011, or the post-COVID rebound — is that demand is accelerating from four directions simultaneously while supply growth has effectively flatlined.
Chapter 2: The Four Horsemen of Copper Demand
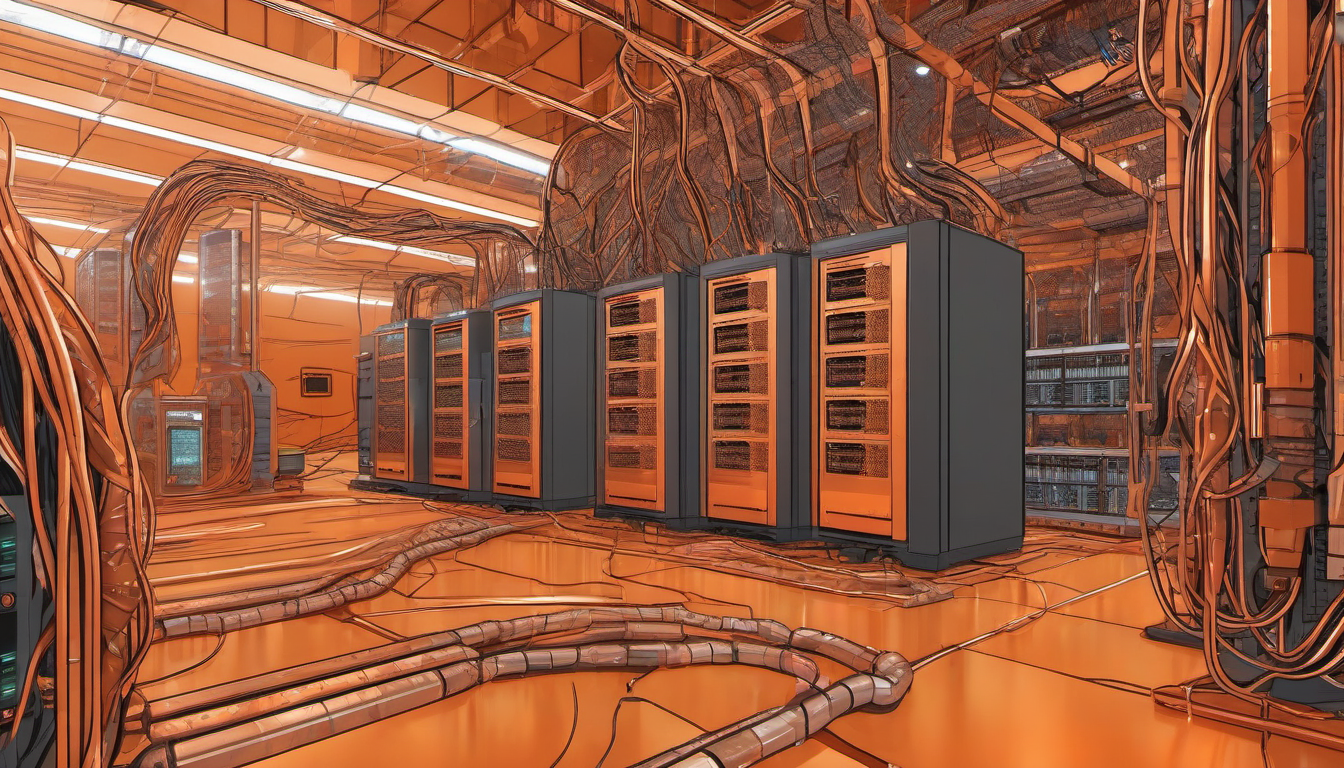
2.1 AI and Data Centers: The New Megaconsumer
Every hyperscale AI data center requires up to 50,000 tons of copper per facility — for power distribution, cooling systems, backup generators, and the grid connections that feed them. Each megawatt of data center capacity demands 6-8 tonnes of copper, with some estimates for Microsoft facilities reaching 27 tonnes per MW.
S&P Global projects data center copper demand will rise from 1.1 million metric tons in 2025 to 2.5 million metric tons by 2040 — an additional 2 million tons attributable specifically to AI infrastructure. With OpenAI's $500 billion Stargate project, Meta's 4GW nuclear partnerships, and Google's Kairos Power deals all breaking ground simultaneously, the front-loading of this demand is already visible in spot markets.
Data centers are expected to consume 475,000-500,000 metric tons annually by 2030 — equivalent to roughly 2% of current global production absorbed by a single sector that barely existed a decade ago.
2.2 Energy Transition: The Copper-Intensive Shift
The energy transition remains the largest structural demand driver. A battery-electric vehicle requires 183 lbs (83 kg) of copper — 3.6 times the intensity of an internal-combustion car. Offshore wind turbines need approximately 8,000 kg of copper per MW. And the global electricity grid must roughly double — from 80 million km to 152 million km by 2050 — requiring an estimated 427 million metric tons of copper over the next 25 years.
S&P Global estimates electrification alone will add 7.1 million metric tons of annual demand by 2040.
2.3 Defense: The Copper Shells Arms Race
In 2022, Russia's 11 million artillery shells fired against Ukraine contained the same amount of copper as 10% of the UK's total wind turbine capacity. Now the world is rearming:
- The U.S. is scaling 155mm shell production from 93,000 to 1.2 million annually
- Germany's Rheinmetall will produce 1.5 million 155mm shells per year — more than the entire U.S. defense industry combined
- Global military expenditure hit $2.718 trillion in 2024, up 9.4% YoY — the steepest surge since the Cold War
Simon Hunt Strategic Services estimates global military demand accounts for nearly 9% of refined copper output and is growing at 14% per year through 2026. This is the demand nobody sees in civilian forecasts.
2.4 Core Industrialization
Rapid urbanization in Southeast Asia and India is projected to add 3.3 million metric tons of demand by 2035. China still accounts for 55% of global copper consumption, and despite its property slowdown, industrial demand remains robust — Beijing has been actively stockpiling copper ahead of anticipated tariff disruptions.
Combined demand trajectory:
| Demand Driver | 2025 (Mt) | 2040 (Mt) | Growth |
|---|---|---|---|
| Core economic | 18.0 | 23.0 | +28% |
| Energy transition | 4.2 | 11.3 | +169% |
| Data centers/AI | 1.1 | 2.5 | +127% |
| Defense | ~2.4 | ~4.0+ | +67%+ |
| Total demand | ~28 | ~42 | +50% |
Chapter 3: The Supply Wall
3.1 Declining Ore Grades
The fundamental problem is geological: the easy copper is gone. Chile's Codelco — the world's largest producer — saw average ore grades fall from 1.02% in 2022 to 0.66% in 2025. Production stagnated at 1.332 million tons in 2025, a 0.3% increase. The company hopes to add just 10,000 tons in 2026.
Peru and Chile together account for roughly one-third of global mined copper, and both are struggling not to grow output, but to sustain current levels.
3.2 The 17-Year Problem
It takes an average of 17 years for a new copper mine to go from discovery to production. This means the supply response to today's price signals won't materialize until the early 2040s — by which point the deficit will already be entrenched.
3.3 Disruptions and Concentration Risk
January 2026 alone saw:
- Contract workers blockaded access roads to Escondida and Zaldivar (the world's largest and a top-10 copper mine) in Chile
- A three-week labor strike halted production at Capstone Copper's Mantoverde mine
- Ongoing effects from the July 2025 rock burst at El Teniente, which cut 48,000 tons of 2025 production and will remove another 25,000 tons in 2026
Six countries account for roughly two-thirds of global mining production. China commands about 40% of global smelting capacity — and Beijing is already demonstrating its willingness to weaponize mineral dominance, as it has with rare earths.
3.4 The Tariff Distortion
Strong U.S. imports ahead of anticipated Trump tariffs on refined copper have diverted material away from traditional markets, draining visible inventories and amplifying tightness. This has created an artificial arbitrage between COMEX and LME prices, further destabilizing global supply chains.
Chapter 4: Geopolitical Scramble — Who Controls the Red Metal?
4.1 The U.S. "Critical Mineral" Declaration
The United States added copper to its official list of critical minerals in 2025 — a significant policy shift that opens the door to Defense Production Act funding, expedited permitting, and strategic stockpile purchases. Trump's 55-nation Critical Minerals Summit and Project Vault ($12 billion) are partly motivated by the copper equation.
4.2 China's Smelting Monopoly
China's 40% share of global copper smelting capacity gives Beijing leverage equivalent to — or exceeding — its rare earth dominance. If China were to restrict refined copper exports, the impact on Western manufacturing, defense production, and data center construction would be immediate and severe.
4.3 Resource Nationalism Rising
Chile proposed a copper royalty increase in 2025. Peru's community-level resistance to new mining projects continues to delay billions in investment. The Democratic Republic of Congo — the world's largest cobalt producer and a significant copper source — faces ongoing governance challenges.
4.4 The Rio-Glencore Failure
The collapse of the proposed $260 billion Rio Tinto-Glencore merger in January 2026 — which would have created the world's largest copper producer — highlighted both the strategic importance of copper and the difficulty of consolidating supply. The 30% price premium demanded by Glencore's shareholders reflected their bet that copper scarcity will only worsen.
Chapter 5: Scenario Analysis
Scenario A: Managed Scarcity (45%)
Premise: Copper prices settle in the $12,000-$15,000/ton range through 2027. Supply grows marginally (1-2% annually). Demand growth moderates as high prices force substitution in some applications and delay low-priority projects.
Historical precedent: The 2006-2008 copper rally saw prices triple from $3,000 to $9,000/ton. Supply eventually responded with new projects in Mongolia (Oyu Tolgoi) and Peru (Las Bambas), but the lag was 5-7 years. Today's higher price floor suggests the market has structurally repriced.
Trigger conditions:
- Codelco and Freeport-McMoRan maintain current output levels
- No major new trade disruptions on refined copper
- AI capex cycle moderates in H2 2026 as some projects face delays
Why 45%: This reflects the most common historical pattern — structural deficits persist but don't spiral because high prices partially ration demand. Past copper cycles show markets can function in deficit mode for 3-5 years before supply adjusts.
Scenario B: Supply Crisis — $15,000+ (30%)
Premise: Copper breaches $15,000/ton and potentially tests $18,000 by late 2026. Multiple supply disruptions compound (Chile labor unrest, Congolese political instability, Chinese export restrictions). AI infrastructure demand accelerates faster than expected.
Historical precedent: The 2021-2022 nickel squeeze saw prices briefly spike 250% when supply was concentrated and disrupted. Copper's higher liquidity makes such extremes less likely, but the 14-day inventory level is comparable to pre-squeeze nickel conditions.
Trigger conditions:
- Chinese copper export restrictions (retaliatory tariff response)
- Major Chilean mine disruption (earthquake, extended strike at Escondida)
- AI buildout front-loading accelerates in Q2-Q3 2026
Why 30%: The concentration of supply in a few countries creates tail risks similar to what we've seen with rare earths. Three of the top five producers (Chile, Peru, DRC) face significant political/labor risks. China's willingness to weaponize commodities has been demonstrated. The 14-day inventory buffer provides minimal cushion.
Scenario C: Demand Destruction — Price Correction (25%)
Premise: Copper pulls back to $10,000-$11,000/ton as global recession fears mount. The U.S. "double whammy" week (jobs + CPI data) on February 11/13 reveals stagflationary conditions. AI investment slows. China's property sector drags harder than expected.
Historical precedent: In 2008, copper crashed from $8,700 to $2,800 (-68%) in six months as the financial crisis destroyed industrial demand. In 2022, recession fears pulled copper from $10,700 to $7,000 (-35%).
Trigger conditions:
- U.S. enters technical recession (Q1-Q2 2026 GDP negative)
- China stimulus disappoints; property sector worsens
- AI capex is cut significantly (similar to crypto winter 2022)
Why 25%: Despite powerful structural demand, copper is not immune to macro cycles. However, the floor is higher than in past corrections because electrification and defense demand are policy-driven and less sensitive to GDP. The 2008 scenario required a banking crisis; current conditions, while stressed, are not comparable.
Chapter 6: Investment Implications
Winners
- Copper miners with low costs: Freeport-McMoRan (FCX), Southern Copper (SCCO), First Quantum Minerals — all benefit from higher prices while operating costs remain relatively stable
- Copper recyclers: With primary supply constrained, secondary copper (recycling) becomes increasingly valuable. Companies like Aurubis and Wieland benefit
- Grid infrastructure: Companies building the electrical grid to connect data centers — Quanta Services, MasTec, Prysmian — are indirect copper plays
Losers
- AI infrastructure builders: Higher copper costs directly inflate data center construction budgets. Each 10% copper price increase adds approximately $2-5 million to a typical hyperscale facility
- EV manufacturers: Battery-electric vehicle margins compress as copper content costs rise
- Emerging market currencies: Countries that are net copper importers face deteriorating terms of trade
The Substitution Myth
Aluminum can replace copper in some applications (power cables, heat exchangers), but not in data centers, defense applications, or EV motors where copper's conductivity advantage is 40% superior. The International Copper Association estimates substitution could offset at most 15% of the projected deficit.
Conclusion
Copper is not just another commodity cycle. It is the physical chokepoint where three of the 21st century's defining forces — artificial intelligence, clean energy, and global rearmament — converge on a supply base that cannot scale fast enough to meet them.
The S&P Global warning of "systemic risk" is not hyperbole. With 14 days of visible inventory, a 17-year mine development timeline, and demand growing 50% by 2040, the market is structurally short copper for the foreseeable future. J.P. Morgan's $6,300/oz gold forecast grabbed headlines, but their implicit message on copper may matter more: this is the commodity that determines whether the AI revolution, the energy transition, and Western rearmament actually happen — or stall.
The question isn't whether copper prices stay elevated. It's whether the world can reorganize fast enough to avoid a crisis that makes the 2021 chip shortage look manageable.
Related Reading
- Rio Tinto-Glencore $260B Merger Collapse
- Silicon Sovereignty: The AI Iron Curtain
- The Arsenal of Freedom: America's Arms Transfer Revolution
Sources: S&P Global "Copper in the Age of AI" (Jan 2026), J.P. Morgan Commodity Research, ICSG, The Oregon Group, Forbes, Fortune, Benchmark Minerals, SIPRI
Leave a Reply